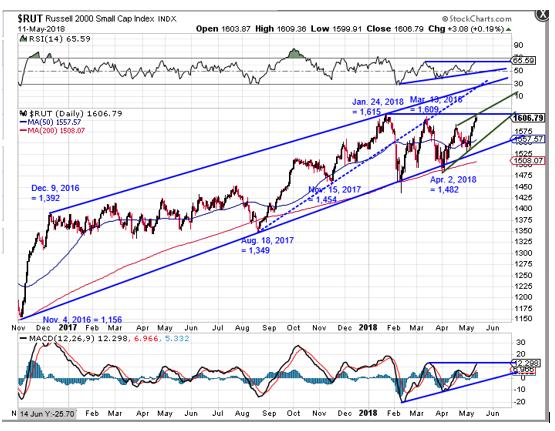
Also putting up a big weekly price rise this past week was the small-capitalization stock Russell 200 Index ($RUT). The $RUT Index closed on May 4 at 1,565. Its chart below which begins at its own “Election day Low” from November 4, 2016 shows that it closed this past Friday at 1,606 for a weekly percentage gain of +2.62%, Since April 2 the $RUT Index has risen by +8.36%. By comparison the S&P 500 Index has risen by +5.65%. The Dow Industrial Average has risen by +5.02%. By any measure the small-capitalization stocks that make up the $RUT Index have far outperformed the large-capitalization stocks which compose the S&P and Dow Industrial Average for the past 6 weeks. Usually outperformance by the smaller stocks over the larger stocks is a bullish sign for the overall stock market.
Our chart below shows that as of this past Friday, the $RUT Index had almost equaled its own March 13 “lower high” at 1,609. One cannot help but to notice that the $RUT Index “lower high” made on March 13 was not really all that much below its all-time price high from January 24 made at 1,615. This is a stark contrast to the S&P 500 “lower high” made on March 9 which was below its January 26 all-time price high by -3.0%. In fact, the $RUT Index never really established a down-trend line of successively falling highs after January 24. Going into the upcoming week it lies just -9 points below that January 24 all-time price high. The chart below shows that the $RUT Index “Trump Rally” up-trend line was never seriously broken to the downside as was the S&P 500 “Trump Rally” up-trend line. Thus, it has no similar broken up-trend line technical resistance to overcome on its way back up. All in all the $RUT Index chart presents a much healthier upward price trend picture than does the S&P 500 chart.
One reason we can think of for why the $RUT Index chart is a healthier looking chart is that the stocks that comprise the $RUT Index do not have large enough market capitalizations to accommodate the speculative appetites of the multi-billion dollar leveraged hedge funds. These self-serving pirates need stocks that have extremely high daily trading volume in both shares and dollars to accommodate their speculative activities and the small-cap stocks in the $RUT Index have neither. The small-cap stocks in the $RUT Index also do not have especially active or deep markets in their stock option contracts which is something the hedge-fund pirates desire for hedging their short-term, high-dollar bets. In general, the less hedge fund activity a stock or index has in its shares the better behaved it is likely to be. The chart picture below of the $RUT Index compared to the picture of the S&P 500 over the exact same time period certainly seems to support that hypothesis.

Stonehenge Analytics can find nothing on the chart above that might indicate that the $RUT Index will not push up to a new and higher all-time price high sometime during the next 2 to 6 weeks. The top line of its currently operative 18-month up-trend channel is up at approximately the 1,675 price level. Our chart above shows that an old and broken short-term up-trend line of rising August 18, 2017 and November 15, 2017 lows (dashed blue up-trend line on chart) has already intersected the top line of the 18-month up-trend channel. Other than the technical resistance likely to be presented by the January 24 all-time price high itself these are the only two other sources of resistance to $RUT Index price rise. Both technical indicators have constructed up-trends of rising short-term lows to confirm the $RUT short-term up-trend of rising lows since April 2. It is therefore our expectation that the $RUT Index will continue to outperform both the S&P 500 and the Dow Industrial Average to the upside over the next 6 weeks through the end of June. In our view the $RUT Index will stand a very good chance of rising to the 1,675 price level prior to June 30. The $RUT Index is tracked by the iShares Russell 2000 Index ETF whose ticker symbol is IWM. Our opinion is that it still remains a viable purchase target for both longer-term investment-oriented accounts and shorter-term trading oriented accounts on any short-term “pullbacks” which it might experience between today and the end of May