We will be on summer holiday until August. Stay safe.
Author: Stonehenge Analytics
Biotechnology Stocks Index ($BTK) Sets New All-time Daily, Weekly-close Highs
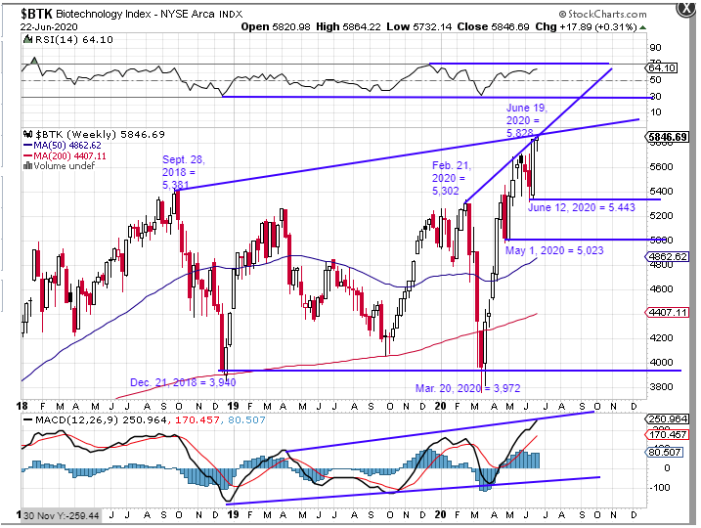
As previously mentioned, the NYSE-Arca Biotechnology Stocks Index ($BTK) has been one of the strongest stock sectors leading the recovery rally in place since March 23. The chart above that begins on January 2, 2018 shows it posting a new all-time daily and weekly-close price high this past Friday at 5,828.We should take note of the fact that the $BTK Index never broke below its previous intermediate-term weekly-close low at 3,940 from December 21, 2018. In fact, its March 20, 2020 weekly-close low was a successful re-test of that December 21, 2018 low. Technical indicators above and below the price chart confirm this interpretation.
The biotechnology company stocks are a favorite price momentum play of the mostly short-term oriented and speculative accounts that have been driving their prices upward since March 23. One never really knows how far up in price their chase after upward price momentum will take a stock and a “hot” stock sector. The $BTK Index could very well continue adhering to the steeply upwardly sloped trend line we have drawn on the chart that connects its February 21 and June 19, 2020 rising high weekly price closes. However, we also know that one day this momentum chase will come to an end. When it does, the chart history shows that the $BTK Index has fallen both rapidly and far, from September 28, 2018 through December 21, 2018 and again from February 21 through March 20, 2020. Stonehenge Analytics therefore cautions longer-term and more investment-oriented accounts that the time for them to buy into this very strong stock sector is at or near to the conclusion of one of these rapid and steep sell-offs, not near to the top of the price momentum chase upward. Our opinion is that longer-term investment-oriented accounts would be wise to exercise patience and wait for a sell-off that takes the $BTK Index down at least to a re-test of its May 1 daily-close price low at 5,023. That downside target is below the Friday closing price of 5,828 by -13.8%.
Long-term investment-oriented accounts can participate in owning the biotechnology stock sector using the SPDR S&P Biotechnology Stocks Sector ETF, ticker XBI. It also set new daily and weekly-close price highs this past Friday at $108.85/share. Its daily-close price low made on May 1 was at $90.83/share. This downside target price is below the Friday closing price by -16.5%.
Stocks Rebound from Prior Week Sell-Off
NASDAQ Leads Higher, Sets New All-time Weekly-Close High
Despite the fact that new COVID-19 cases spiked sharply higher this past week in states that have fully or nearly fully re-opened their economies, Wall Street shrugged of its concerns about a nationwide resurgence of the COVID-19 pandemic to focus instead on the prospect that even such a resurgence would be unlikely to blunt the gathering momentum among state governors to continue their current courses of phased re-openings of their local economies. This optimism in turn fueled optimism that business activity in general would continue to accelerate to the upside, and the belief in a “V”-shaped economic recovery gained increasing numbers of adherents among economic forecasters.
The fact is though that the recovery rally in place since March 23 has always been led higher by the stocks of the companies whose business models directly benefit from full and partial economic “lockdowns”. This most especially includes computer technology companies whose products and services facilitate working, schooling, shopping, eating and entertaining oneself within the confines of one’s own home. It also includes the stocks of companies whose top and bottom lines stand to benefit hugely from their development and later production of successful and easy to administer COVID-19 testing kits, therapeutic treatment drugs, and most especially the holy grail of a safe, effective, clinically proven vaccine. Just about all of the companies whose stocks are contained in the NYSE-Arca Biotechnology Stocks Index ($BTK) are engaged in one of more of these pursuits, and their stocks have risen to new all-time price highs accordingly. Such was the case again this past week, as the $BTK Index rose to close the week at new all-time daily and weekly-close price highs.
Stonehenge Analytics will take a self-congratulatory moment here to remind all that our sister monthly publication, Druitt’s Market Letter, correctly and quite accurately forecast that the computer technology and biotechnology stock sectors would continue leading the major stock indices higher in its June 1 edition. Three weeks into the month this prophecy has proven to be dead-on accurate.
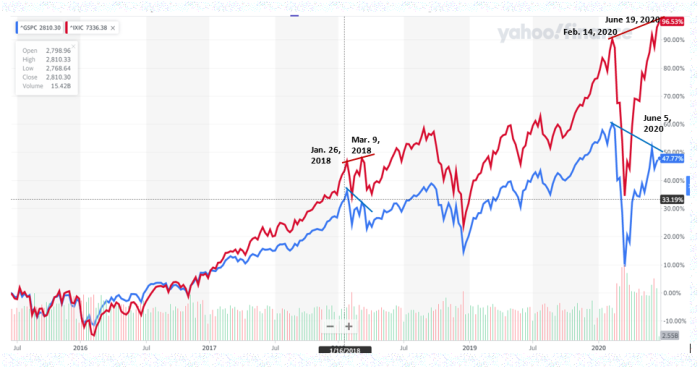
Our 5-year comparison chart above compares the NASDAQ Composite Stock Index (red line) with the much broader-based S&P 500 Index since June 2015. It shows that the continued strong surge upward by the NASDAQ has not been matched by the S&P since the week that ended on June 5. The S&P rally has stalled out since that date, and it increasingly appears as though the S&P will likely fail to match the NASDAQ’s achievement of a new all-time price high during June and perhaps also July. As the chart shows, the S&P currently displays a down-trend line of successively falling February 14 and June 5 weekly-close price highs in stark contrast to the NASDAQ’s strong up-trend line of successively rising February 14 and June 19 weekly-close price highs. This is a negative divergence in stock market technical parlance, and if it persists the history of such divergences tells us that it will not work out favorably for either index. A previous example of just such a negative divergence can be found on the chart from January 26 through March 9, 2018. In that instance a similar to this years’ experience, both indices posted all-time weekly-close price highs on January 26, 2018. Then, both indices posted sharp but short price collapses. The S&P fell by -8.8% on a weekly-close price basis over the next two weeks through February 9, 2018. The NASDAQ fell by -8.4% over the exact same time two-week period. In their following recovery rallies the S&P failed to rise to a new and higher weekly-close price high, topping out on March 9, 2018 at 2,786 compared to its January 26 all-time high at 2,872. The NASDAQ however rose to a new and higher weekly-close high at 7,560, a price level above its previous January 26 high at 7,505 by +0.73%. Afterwards both indices fell simultaneously to new weekly-close price lows recorded on March 23, 2018 by the S&P 500 at 2,588 and recorded on April 6, 2018 at 6,915 by the NASDAQ.
The major technical problem from narrowly-based but strong upward price advances by U.S. major stock indices is that eventually the day comes when the shorter-term and more speculatively-inclined investors and traders that live and die by upward price momentum decide to sell. During the strong upward price trend they all concentrate their trading positions in the relatively few stocks which continue trending upward after the majority of stocks have ceased to do so. Eventually, the day arrives when these more trading-oriented accounts are persuaded that the time has arrived to sell out their positions in order to capture the short-term capital gains profits they have earned with their astute trading skills. When they do so there is no strong stock sector to take the place of the suddenly weak leading sectors, and all sectors fall in price simultaneously. Associated price declines are rarely slow-moving affairs but are instead very rapid collapses made even the more so that the fact that the speculative trading accounts that pushed up the prices of the leading stocks employed large quantities of financial leverage to do this. As those stocks’ prices rapidly fall the margin calls go out and speculative accounts are forced to sell against their will in order to meet those margin calls. Forced liquidations to meet margin calls always produce the most rapid, and usually most damaging price collapses.
Short-term 5-week Moving Average of NYSE weekly “Percent of Stocks Rising” Ratios Set to Fall
—This Week’s Market
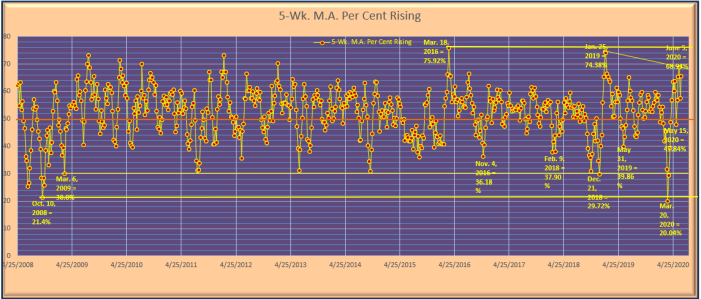
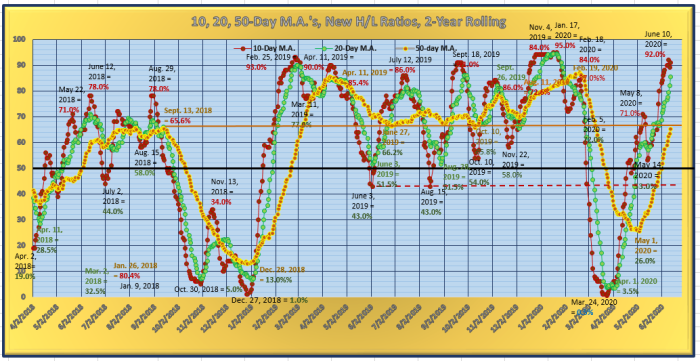
The chart above is from the Stonehenge Analytics in-house chart library. It is a “stand alone” chart of the short-term 5-week moving average of NYSE weekly “percent of stocks rising” ratios derived from NYSE weekly advance/decline statistics. The 5-week moving average rose this past week to 65.48%, quickly recovering from a single week decline to 57.44% in the week of June 8-12. However, a look at the upcoming weekly ratios due to drop and be “replaced” in its calculation shows us that there will not be much chance that it continues to rise for the next three weeks through Friday, July 10. The June 5 high inflection point at 68.94% is most unlikely to be challenged.
Upcoming weekly “percent of stocks rising” ratios due to drop and be “replaced” in the 5-week moving average calculation will average 85.7%/week through July 10. There is virtually no chance that the NYSE might match or exceed this three-week average. The pertinent question to ask is whether or not there might be a reasonable probability that the 5-week moving average will drop below the critical 50.0% line by July 10. In order for this to happen the NYSE must produce weekly “percent of stocks rising” ratios that average less than 59.9%/week for the next three weeks. Since the “percent of stocks rising” ratio produced this past week by the NYSE was below this “hurdle rate” at 56.5% the answer is that there is indeed a reasonable probability that the 5-week moving average will fall below the 50.0% line by Friday, July 10. Historically, movements by the 5-week moving average below the 50.0% line have been accompanied by brief price “pullbacks” by the S&P 500 and other major stock indices. The most recent occurrence was in the week of May 11-15 during which the S&P 500 fell by -2.25% on a weekly-close price basis. We therefore should not be surprised if the four major U.S. stock indices again experience brief price “pullbacks” between today and July 10. We emphasize however that the chart above depicts a strictly short-term price momentum indicator. And, there is virtually no chance that the 5-week moving average might continue to fall in the week of July 13-17 because the weekly ratio due to be “replaced” in its calculation that week will be an exceptionally low 13.8% from the week of June 8-12. We expect that the S&P 500 will likely rally upward very strongly from July 13 through July 24 to again challenge its recovery rally weekly-close price high from Friday, June 5 at 3,193.
Our in-house daily data moving averages of NYSE daily new high/new low ratios and daily advance/decline ratios do not favor upward or downward weekly price movement this week by the S&P 500 Index. What is certain is that both the new high/new low ratios and advance/decline ratio moving averages will strongly favor downward price movement in the holiday-shortened week of June 29-July 3 (markets will be closed on Friday, July 3 to observe the Independence Day Holiday). And, as our chart above strongly indicates, the S&P 500 price trend will likely be downward through Friday, July 10. We are therefore highly skeptical that the S&P might rise above its June 19 intraday price high at 3,155 this upcoming week. To the downside our initial downside target is at the S&P intraday low from June 12 at 2,986.We caution however that when speculative momentum stock players begin to run for the exit doors it can quickly turn into a stampede. A significantly lower S&P price could be seen by the end of the week.
Druitt’s Weekly Data Charts
Week Ending June 19, 2020
This week’s chart package presents strong historical evidence that the end of the recovery rally by U.S. stock indices since March 23 is now coming into plain view. The rally is not likely to last beyond Friday, July 24. Our very strong opinion is that long-term investment-oriented accounts would be very foolish to purchase stocks at the current time and at current price levels this close in time to a highly probable conclusion to the upward price trend which has prevailed since March 23.
Three of the four major U.S. stock indices closely tracked by the Weekly Data Charts newsletter ended this past week with weekly price gains. The outlier was the Dow Transportation Stocks Average that closed the week with a tiny weekly loss of -4 points (-0.05%) at 9,077. By far the best performing index for the week was the technology stock-heavy NASDAQ Composite that closed with a weekly gain of +357.32 points (+3.73%) at 9,946.12. The broad-based S&P 500 ended the week with a gain of +56.43 points (+1.86%) at 3,097.74. The Dow Industrial Average closed the week with a gain of +265 points (+1.04%) at 25,876. For the NASDAQ Composite Index Friday’s closing price was a new all-time weekly-close price high.
Price momentum data from the NYSE and the many ratios and moving averages of that data constructed and tracked by this newsletter produced mostly bullish weekly movements. However, among the new high/new low data- based moving averages the moving averages of NYSE weekly new 52-week highs continued to show that the inability of the NYSE to rapidly expand the weekly “New High” continues to be the Achilles heel of the recovery rally in place since March 23. Of the five 5-week through 40-week moving averages of NYSE weekly new 52-week highs only the short-term 5-week and short intermediate-term 10-week moving averages rose. The 5-week moving average finally crossed above the 100 new highs mark to 105 new highs. It has consumed 10 weeks struggling to rise to this level. The next-longer 10-week moving average still has not surpassed the 100 new highs mark, rising to 80.9 new highs after five consecutive weekly advances. All three 20-week through 40-week moving averages continued to decline.
Moving averages of NYSE weekly new 52-week lows continued falling across the board from 5-week through 40-week moving average time periods. It remains the acute absence of selling pressure which is allowing the upward price trends of the four major stock indices to continue unmolested. The shortest-term 5-week moving average fell to just 20 new lows this past week. While this is a depth to which it has only rarely sunk in the past, it can and has gone lower, having reach an all-time low of just 4 weekly new 52-week lows in September 2009.
With moving averages of NYSE weekly new lows sinking toward historically extremely low levels the moving averages of NYSE weekly new high/new low ratios rose at all 5-week through 30-week moving average time periods and was effectively unchanged at the 40-week time period. The shortest-term 5-week moving average rose to 83.6% and is now fast approaching its high inflection point from January 17 of this year at 93.0%. We should note that this high water mark was posted approximately one month in advance of the S&P 500, Dow Industrial Average and NASDAQ Composite Index posting their all-time daily-close price highs in mid-February.
Moving averages of NYSE weekly “percent of stocks rising” ratios rose at the 5-week, 20-week and 30-week time periods, but fell at both the 10-week and 40-week time periods. The decline of the 10-week moving average was expected because its calculation was “replacing” a monster ratios of 95.4% from the week of April 6-10. All five-week through 40-week moving averages remained comfortably above the critical 50.0% line.
Yield spread data from the U.S. bond market was bullish for the major stock indices. The “Merrill Lynch Confidence Index” rose to 38.98 from 37.48 on June 12, putting that date and level on the board as at least a short-term low inflection point. The “junk” “BB”-rated Bond Index yield fell to 4.72% from 5.07% on June 12. The Corporate Bond/Treasury Bond Yield Spread fell, dropping by -2 basis points to +117 basis points from +119 basis points on June 12.
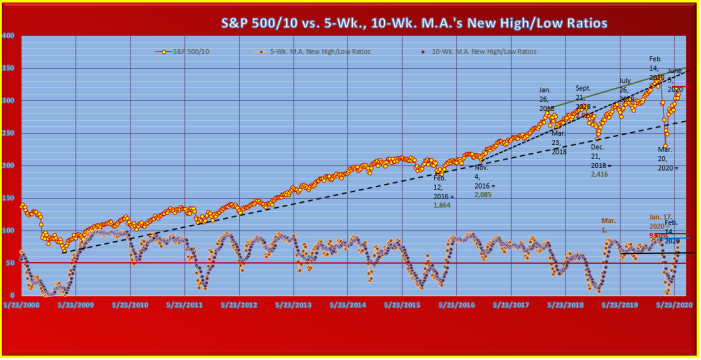
Our long-term chart of the S&P 500 Index that uses only its weekly-close prices also compares that index with both the short-term 5-week and short intermediate-term 10-week moving averages of NYSE weekly new high/new low ratios. We have divided the S&P 500 price lone on the chart by a factor of 10 for scaling purposes. Price levels for specific dates noted are actual, unscaled price levels.
The S&P 500 portion of the chart shows that the weekly-close price high to date for the recovery rally since March 23 was posted on Friday, June 5 at 3,193. At its close this past Friday at 3,097 the S&P was below this recovery rally high by -3.0%. We have placed a horizontal technical resistance line at the June 5 weekly-close high to designate it as a potential future technical resistance to further price rise. This resistance line is likely to be tested between today and mid-July.
On the 5-week and 10-week moving averages of NYSE weekly new high/new low ratios portion of the chart we first wish to call attention to the short-term 5-week moving average which moved up this week to end at 83.6%. As the chart shows, it is now drawing ever-closer to its January 17 peak high inflection point at 93.0%. Please note that this was an intermediate-term rather than a short-term high inflection point. It was posted approximately one month in advance of the associated S&P 500 all-time weekly-close price high made on February 14, 2020 at 3,380. When we look at the upcoming weekly ratios due to drop and be “replaced” in the 5-week moving average calculation we should conclude that there is considerable doubt that the 5-week moving average will rise to match its January 17, 2020 peak high.
Upcoming ratios due to drop and be “replaced” in the 5-week moving average calculation will average 83.6%/week for the next five weeks through Friday, July 24. In the three weeks starting with the week of July 6-10 they will average 87.0%/week. This past week’s ratio was 83.0%. There is therefore a very nearly certain probability that the 5-week moving average will produce a peak high inflection point and turn downward by no later than Friday, July 24. Using the one-month time lag between its peak high on January 17, 2020 and the S&P 500 peak high weekly-close price on February 14, 2020 as a guide we can estimate that the S&P 500 recovery rally will end no later than on Friday, August 21 and could end well before that date if the 5-week moving average peak high is posted before July 24.
Turning our attention to the next-longer 10-week moving average of NYSE weekly new high/new low ratios we see that as of this week it has risen to 66.8%. This puts it right at the technical resistance line we have placed across its June 28, 2019 and August 30, 2019 “twin lows” at 67.6% and 68.0% respectively. We should have no doubts that by next Friday the 10-week moving average will have no problem pushing up through and above this resistance line because for the next two weeks the weekly ratios due to drop and be “replaced” in its calculation will be very low figures of 45.0% and 38.0%. In fact, for the upcoming five weeks through July 24 weekly “replacement” ratios will average just 49.9%/week. After July 24 that weekly “replacement” ratio average will rise to 83.6%/week through Friday, August 28. We can be reasonably confident that the 10-week moving average will continue rising through at least Friday, July 24. But, for it to rise to equal its February14 peak high from earlier this year by July 24 will require that the NYSE produce weekly new high/new low ratios that will average 90.0%/week for the next five weeks. The NYSE is very unlikely to do such a thing. We can therefore also be reasonably confident that the horizontal technical resistance line we have placed at the 10-week moving average peak high from February 14, 2020 will hold and not be penetrated to the upside.
Earlier this year the S&P 500 all-time weekly-close price high was made exactly simultaneously with the 10-week moving average intermediate-term peak high inflection point on February 14, 2020. Since we can fairly accurately forecast that the 10-week moving average will post its recovery rally peak high inflection point for Friday, July 24 we may also fairly accurately forecast that the S&P 500 recovery rally peak high weekly-close price high will be made no later than on that date.
Click on link to see entire document, view in web-layout mode;
New High/New Low Ratio Moving Averages Charts
Weekly Charts
An incomplete post today due to Technical Difficulties.
Week Ending June 19, 2020
Three of the four major U.S. stock indices closely tracked by this newsletter are ending the week with weekly price gains. The outlier is the Dow Transportation Stocks Average that will close today with a tiny weekly loss of -4 points (-0.05%) at 9,077. By far the best performing index for the week is the technology stock-heavy NASDAQ Composite that will close with a weekly gain of +357.32 points (+3.73%) at 9,946.12. The broad-based S&P 500 will end the week with a gain of +56.43 points (+1.86%) at 3,097.74. The Dow Industrial Average will close the week with a gain of +265 points (+1.04%) at 25,876. For the NASDAQ Composite Index today’s closing price is a new all-time weekly-close price high.
The six various time-length moving averages of the NYSE daily ratio of new 52-week highs divided by that day’s total of both new 52-week highs and new 52-week lows are confirming the weekly price rises registered by three of the four major U.S. stock indices. One week ago they failed to confirm the brief “panic attack” price declines experienced from June 8 through June 15 by all four indices. We therefore should not be surprised with this week’s immediate reversal of last week’s “panic attack” by the NASDAQ Composite, S&P 500 and Dow Industrial Average. Among the six moving averages all but the shortest-term 10-week moving average are recording weekly rises. The 10-day moving average is virtually unchanged from one week ago, slipping down to 90.0% from 91.0% on June 12. Needless to say, of the NYSE is consistently producing daily new high/new low ratios that average 90.0%/day then price momentum remains very strongly upward.
The bigger news this week is that all four 50-day through 200-day moving averages recorded weekly rises. This represents a directional change for the intermediate-term 100-day moving average to rising from falling. “Replacement” columns in this week’s regular table (MISSING) for both the 100-day and 150-day moving averages will favor that they continue rising in the upcoming week of June 22-26. The 100-day moving average calculation will be “replacing” daily ratios that average 68.6%/day and the 150-day moving average calculation will be “replacing” daily ratios that average 58.7%/day. Both of these “replacement” rates are well below the current levels of all three 10-day through 50-day moving averages. However, the longest-term 200-day moving average calculation must “replace” daily ratios that will average a very high 90.4%/day in the upcoming week and average 91.4%/day in the following holiday-shortened week of June 29-July 3 (markets will be closed on Friday, July 3 in observance of the Independence Day Holiday). We can make no assumption that the 200-day moving average will continue to rise. In fact, a directional reversal to falling from rising will be much more likely.
“Replacement” columns in this week’s table for the two short-term 10-day and 20-day moving averages also will strongly favor that these two NYSE new high/new low ratio moving averages which are most closely correlated with the direction of movement of the S&P 500 Index will fall simultaneously in the holiday-shortened week of June 29-July 3. The 10-day calculation must “replace” daily ratios that average 92.6%/day and the 20-day average must “replace” daily ratios that average 95.3%/day. Both “replacement” rates are higher figures than is the current 10-day moving average. We should therefore anticipate that the S&P 500 and other major indices will experience at least a short-term “pullback” in the final week of June and first two days of July. This could develop into something which lasts longer and inflicts more price damage than does a typical “pullback”. Much will depend upon the news bulletins regarding the pace of business re-opening from the COVID-19 lockdowns, or the lack thereof. Today’s announcement by Apple Computer (AAPL) that it is re-closing its retail stores in four states (Florida, Arizona, North Carolina, South Carolina) which have experienced sharp upward spikes in new COVID-19 infections does not offer an optimistic news outlook.
“Replacement” columns for both short-term 10-day and 20-day moving averages for the two upcoming weeks show that both moving averages will be severely challenged to rise in both weeks. The probability that both will turn down very nearly simultaneously from short-term weekly high inflection point greatly increases the likelihood that the S&P 500 and other major indices will change their directions of price movement with them, based upon history. A short-term “pullback” may already have begun if the S&P 500 daily-close high water mark at 3,232 it posted on June 8 is to be used as the starting point.
“New High/New Low Ratio Moving Averages Charts”
Dear Readers,
Due to the debilitating effects of an intestinal infection we are not able to publish either the “New High/New Low Ratio Moving Averages Charts” nor the “Druitt’s Weekly Data Charts” newsletters this week. This weekend is being devoted to rest and recovery from this illness. We hope and expect to resume publication of both newsletters on Friday, June 19 and Saturday, June 20.
Thanks to all for their forbearance. We can and will report that the New High/New Low Ratio Moving Averages did not confirm this past week’s price declines by all four major U.S. stock indices. In fact, all three 10-day through 50-day moving averages recorded weekly rises, as did the longest-term 200-day moving average. A daily-data chart of the 10-day through 50-day moving averages is attached below.
Global Stock Markets Confirm U.S. Rallies
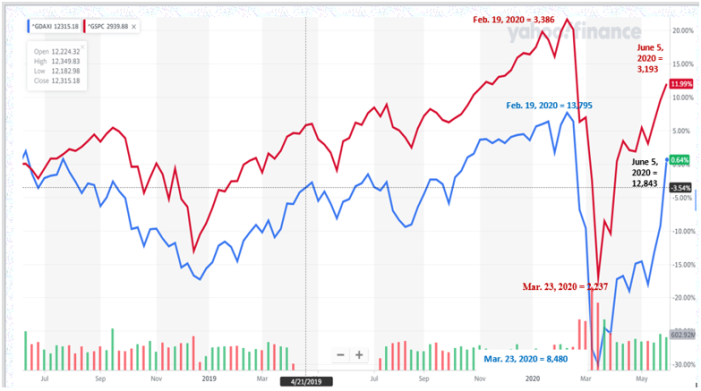
The chart below compares the benchmark U.S. index, the S&P 500 with the benchmark European stock index, the German $DAX Index for the past two years. It is essential for U.S. investors to believe that strongly bullish price movements made by their U.S. indices are being matched by equally strong bullish price movements by global stock indices, particularly European indices. The comparison chart below shows that the strongly bullish moves by the S&P 500 are indeed being matched by equally strong bullish moves by the $DAX.
Since its March 23 “Coronavirus Crash daily-close price low at 2,237 was posted the S&P 500 has gained +42.7%. Over the same time period the German $DAX has gained +51.5%. The chart below shows that both indices are fast approaching their respective all-time daily-close price highs from February 19 of this year. For both indices these price levels will be natural technical resistance obstacles to continued upward movement. When the time comes, it will be interesting to see of both indices can succeed on “breaking out” to the upside through and above these natural technical resistances. An upside “breakout” by one that is not confirmed by the other would be a negative divergence that would likely warn that the rapid upside price trends for both since March 23 were nearing their ends. But, an upside “breakout” by one index that is quickly confirmed by the other would be a bullish signal that both indices would likely continue rising price trends for several weeks or months into the future.
Stocks Roar Ahead on Monthly Jobs Gain
NASDAQ Composite Set New All-time Weekly-Close Price High
All four major stock indices closely tracked by the Stonehenge Analytics newsletter produced huge weekly price gains this past week, capped off by monster daily gains on Friday in response to a surprisingly strong monthly employment report from the Bureau of Labor Statistics. The BLS reported that non-farm payrolls actually expanded by +2.5 million jobs in May, as the lifting of state “lockdown” orders had been followed by recalls of furloughed workers much more quickly than had been anticipated by virtually all economic forecasters. This unexpected addition to U.S. payrolls lowered the nation’s unemployment rate to 13.3% from 14.7% in April. Friday’s stock market reaction was a massive, broad-based rally that added to the already impressive weekly price gains registered from Monday through Thursday. Both the Dow Transportation Average and Dow Industrial Average rose by more than +3.0% on Thursday alone.
The top performing index for the week on a percentage basis was the Dow Transportation Stocks Average that gained +903 points (+10.07%) to close at 9,872. The next best performer on a percentage basis was its companion Dow Industrial Average that gained +1,727 points (+6.81%) to close at 27,110. The broad-based S&P 500 Index rose by +149.62 points (+4.91%) to close at 3,193.93. For these three indices their Friday closing prices were their highest daily and weekly-close prices for their recovery rallies in place since March 23. But, none reached the promised land of setting new 52-week or all-time price highs. The technology stock-heavy NASDAQ Composite Index that rose by +324.21 points for the week (+3.42%) to close at 9,814.08 did reach that promised land by setting a new all-time weekly-close price high, topping its previous all-time weekly-close high from February 14 of this year at 9,731.18. The NASDAQ barely missed setting a new all-time daily-close high, falling short of topping its February 19 daily-close high at 9,817.18.
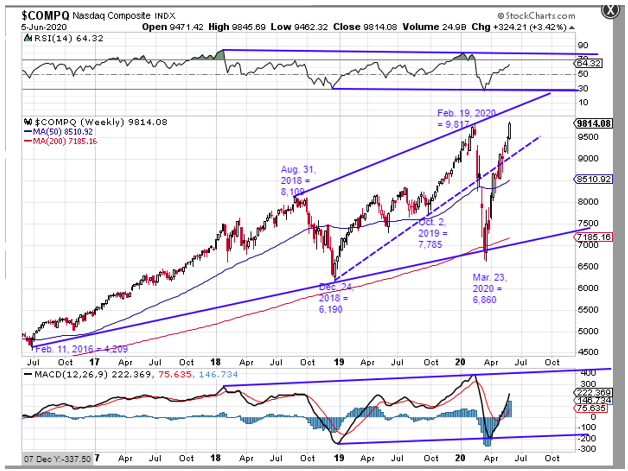
The chart below of the NASDAQ Composite Index ($COMP) begins on January 2, 2016.It shows that the $COMP Index never broke its long-term up-trend line of rising February 11, 2016 and December 24, 2018 lows to the downside at its March 23 “Coronavirus Crash” low. For the $COMP Index there has been no “bear market”, regardless of what talking heads on financial news media outlets might have said to the contrary. The $COMP Index has completely regained the dashed, broken intermediate-term up-trend line of rising lows made after December 24, 2018 which sustained its upward run to a new all-time daily-close price high it posted on February 19 of this year just +3 points above its Friday closing price. We should not be surprised that it is the first of the major U.S. stock indices to find its way back onto the “New High” list.
Technical indicators above and below the price chart display bullish trend channels since January 2018 which confirm the conclusion that there has been no “bear market” by the $COMP Index. We will point out that both indicators still have plenty of upside room to run before reaching the top channel lines of their respective trend channels. The Stonehenge Analytics expectation is that the $COMP Index will continue trending upward in price at least until it reaches the line of rising August 31, 2018 and February 19, 2019 highs we have drawn on its chart. This line is currently at approximately 10,200 and is rising with time. By August 1 it will be at approximately 10,350. This upside target price is above the Friday closing price of 9,814 by +5.5%. From a technical chart perspective there is little standing in the way of the $COMP Index attaining that target price, or even higher, over the summer months.
“BB”-rated “Junk” Bond Yield Falls to Post-March 20 Low—
This Week’s Market
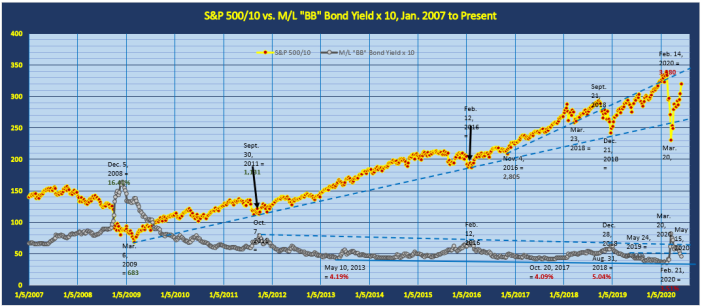
The long-term chart below is from the Weekly Update in-house chart library. It compares the S&P 500 Index with the Merrill Lynch “BB”-rated Bond Index yield. On the chart below we have divided the S&P 500 price line by a factor of 10 and multiplied the “BB”-rated Bond Index yield by a factor of 10 for scaling purposes. Levels shown for specific dates on both data series are actual, unscaled levels.
The S&P 500 portion of the chart shows that there are few remaining technical obstacles to the S&P continuing to rise until it at least matches its February 14 all-time weekly-close price high at 3,380. The old, broken “Trump Rally” up-trend line of rising November 4, 2016 and March 23, 2018 weekly-close lows still remains as a potential technical restraint, but it is currently at approximately 3,325 and by mid-July will have risen above the February 14 all-time high.
The “BB”-rated Bond Index yield portion of the chart shows that as of this past week it has fallen down through and below a potential technical support at its May 24, 2019 “lower high” yield of 4.84%. There are few if any technical obstacles between its current level of 4.63% and its February 21 all-time yield low at 3.51%.
The entire chart history demonstrates how closely correlated are “BB”-rated Bond Index yield intermediate to long-term yield highs with S&P 500 intermediate to long-term weekly-close price lows and vice-versa. What this long history tells us is that a continuing downward trend by the “BB”-rated Bond Index yield will result in a continuing upward trend in the S&P 500 price. For the present, the key technical level for the “BB”-rated Bond Index yield is that May 24, 2019 “lower high” yield at 4.84%. As long as the yield remains below this level we must presume that it will continue trending downward.
Our in-house daily data moving averages of NYSE advance/decline ratios and new high/new low ratios will once again favor upward weekly price movement by the S&P 500.We would not be terribly surprised if the S&P were to rise as highs as the 3,300 to 3,350 price range by the end of the week. To the downside we do not see much chance that the S&P might fall below the 3,100 price level.
