NASDAQ Leads Higher, Sets New All-time Weekly-Close High
Despite the fact that new COVID-19 cases spiked sharply higher this past week in states that have fully or nearly fully re-opened their economies, Wall Street shrugged of its concerns about a nationwide resurgence of the COVID-19 pandemic to focus instead on the prospect that even such a resurgence would be unlikely to blunt the gathering momentum among state governors to continue their current courses of phased re-openings of their local economies. This optimism in turn fueled optimism that business activity in general would continue to accelerate to the upside, and the belief in a “V”-shaped economic recovery gained increasing numbers of adherents among economic forecasters.
The fact is though that the recovery rally in place since March 23 has always been led higher by the stocks of the companies whose business models directly benefit from full and partial economic “lockdowns”. This most especially includes computer technology companies whose products and services facilitate working, schooling, shopping, eating and entertaining oneself within the confines of one’s own home. It also includes the stocks of companies whose top and bottom lines stand to benefit hugely from their development and later production of successful and easy to administer COVID-19 testing kits, therapeutic treatment drugs, and most especially the holy grail of a safe, effective, clinically proven vaccine. Just about all of the companies whose stocks are contained in the NYSE-Arca Biotechnology Stocks Index ($BTK) are engaged in one of more of these pursuits, and their stocks have risen to new all-time price highs accordingly. Such was the case again this past week, as the $BTK Index rose to close the week at new all-time daily and weekly-close price highs.
Stonehenge Analytics will take a self-congratulatory moment here to remind all that our sister monthly publication, Druitt’s Market Letter, correctly and quite accurately forecast that the computer technology and biotechnology stock sectors would continue leading the major stock indices higher in its June 1 edition. Three weeks into the month this prophecy has proven to be dead-on accurate.
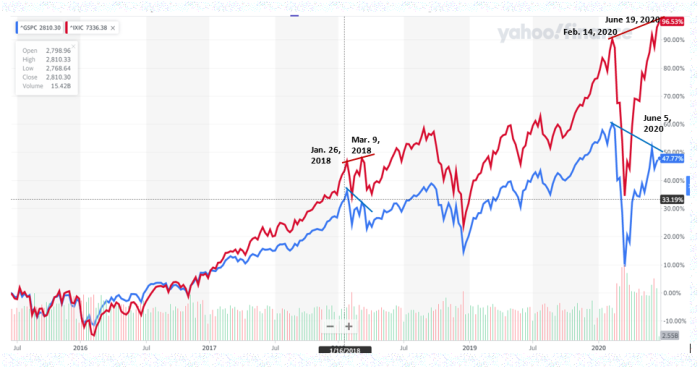
Our 5-year comparison chart above compares the NASDAQ Composite Stock Index (red line) with the much broader-based S&P 500 Index since June 2015. It shows that the continued strong surge upward by the NASDAQ has not been matched by the S&P since the week that ended on June 5. The S&P rally has stalled out since that date, and it increasingly appears as though the S&P will likely fail to match the NASDAQ’s achievement of a new all-time price high during June and perhaps also July. As the chart shows, the S&P currently displays a down-trend line of successively falling February 14 and June 5 weekly-close price highs in stark contrast to the NASDAQ’s strong up-trend line of successively rising February 14 and June 19 weekly-close price highs. This is a negative divergence in stock market technical parlance, and if it persists the history of such divergences tells us that it will not work out favorably for either index. A previous example of just such a negative divergence can be found on the chart from January 26 through March 9, 2018. In that instance a similar to this years’ experience, both indices posted all-time weekly-close price highs on January 26, 2018. Then, both indices posted sharp but short price collapses. The S&P fell by -8.8% on a weekly-close price basis over the next two weeks through February 9, 2018. The NASDAQ fell by -8.4% over the exact same time two-week period. In their following recovery rallies the S&P failed to rise to a new and higher weekly-close price high, topping out on March 9, 2018 at 2,786 compared to its January 26 all-time high at 2,872. The NASDAQ however rose to a new and higher weekly-close high at 7,560, a price level above its previous January 26 high at 7,505 by +0.73%. Afterwards both indices fell simultaneously to new weekly-close price lows recorded on March 23, 2018 by the S&P 500 at 2,588 and recorded on April 6, 2018 at 6,915 by the NASDAQ.
The major technical problem from narrowly-based but strong upward price advances by U.S. major stock indices is that eventually the day comes when the shorter-term and more speculatively-inclined investors and traders that live and die by upward price momentum decide to sell. During the strong upward price trend they all concentrate their trading positions in the relatively few stocks which continue trending upward after the majority of stocks have ceased to do so. Eventually, the day arrives when these more trading-oriented accounts are persuaded that the time has arrived to sell out their positions in order to capture the short-term capital gains profits they have earned with their astute trading skills. When they do so there is no strong stock sector to take the place of the suddenly weak leading sectors, and all sectors fall in price simultaneously. Associated price declines are rarely slow-moving affairs but are instead very rapid collapses made even the more so that the fact that the speculative trading accounts that pushed up the prices of the leading stocks employed large quantities of financial leverage to do this. As those stocks’ prices rapidly fall the margin calls go out and speculative accounts are forced to sell against their will in order to meet those margin calls. Forced liquidations to meet margin calls always produce the most rapid, and usually most damaging price collapses.
