—This Week’s Market
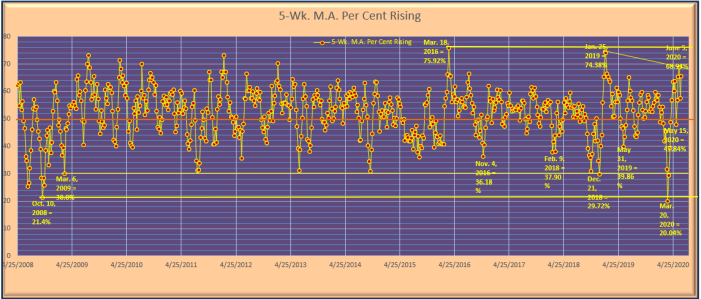
The chart above is from the Stonehenge Analytics in-house chart library. It is a “stand alone” chart of the short-term 5-week moving average of NYSE weekly “percent of stocks rising” ratios derived from NYSE weekly advance/decline statistics. The 5-week moving average rose this past week to 65.48%, quickly recovering from a single week decline to 57.44% in the week of June 8-12. However, a look at the upcoming weekly ratios due to drop and be “replaced” in its calculation shows us that there will not be much chance that it continues to rise for the next three weeks through Friday, July 10. The June 5 high inflection point at 68.94% is most unlikely to be challenged.
Upcoming weekly “percent of stocks rising” ratios due to drop and be “replaced” in the 5-week moving average calculation will average 85.7%/week through July 10. There is virtually no chance that the NYSE might match or exceed this three-week average. The pertinent question to ask is whether or not there might be a reasonable probability that the 5-week moving average will drop below the critical 50.0% line by July 10. In order for this to happen the NYSE must produce weekly “percent of stocks rising” ratios that average less than 59.9%/week for the next three weeks. Since the “percent of stocks rising” ratio produced this past week by the NYSE was below this “hurdle rate” at 56.5% the answer is that there is indeed a reasonable probability that the 5-week moving average will fall below the 50.0% line by Friday, July 10. Historically, movements by the 5-week moving average below the 50.0% line have been accompanied by brief price “pullbacks” by the S&P 500 and other major stock indices. The most recent occurrence was in the week of May 11-15 during which the S&P 500 fell by -2.25% on a weekly-close price basis. We therefore should not be surprised if the four major U.S. stock indices again experience brief price “pullbacks” between today and July 10. We emphasize however that the chart above depicts a strictly short-term price momentum indicator. And, there is virtually no chance that the 5-week moving average might continue to fall in the week of July 13-17 because the weekly ratio due to be “replaced” in its calculation that week will be an exceptionally low 13.8% from the week of June 8-12. We expect that the S&P 500 will likely rally upward very strongly from July 13 through July 24 to again challenge its recovery rally weekly-close price high from Friday, June 5 at 3,193.
Our in-house daily data moving averages of NYSE daily new high/new low ratios and daily advance/decline ratios do not favor upward or downward weekly price movement this week by the S&P 500 Index. What is certain is that both the new high/new low ratios and advance/decline ratio moving averages will strongly favor downward price movement in the holiday-shortened week of June 29-July 3 (markets will be closed on Friday, July 3 to observe the Independence Day Holiday). And, as our chart above strongly indicates, the S&P 500 price trend will likely be downward through Friday, July 10. We are therefore highly skeptical that the S&P might rise above its June 19 intraday price high at 3,155 this upcoming week. To the downside our initial downside target is at the S&P intraday low from June 12 at 2,986.We caution however that when speculative momentum stock players begin to run for the exit doors it can quickly turn into a stampede. A significantly lower S&P price could be seen by the end of the week.
