Week Ending June 19, 2020
This week’s chart package presents strong historical evidence that the end of the recovery rally by U.S. stock indices since March 23 is now coming into plain view. The rally is not likely to last beyond Friday, July 24. Our very strong opinion is that long-term investment-oriented accounts would be very foolish to purchase stocks at the current time and at current price levels this close in time to a highly probable conclusion to the upward price trend which has prevailed since March 23.
Three of the four major U.S. stock indices closely tracked by the Weekly Data Charts newsletter ended this past week with weekly price gains. The outlier was the Dow Transportation Stocks Average that closed the week with a tiny weekly loss of -4 points (-0.05%) at 9,077. By far the best performing index for the week was the technology stock-heavy NASDAQ Composite that closed with a weekly gain of +357.32 points (+3.73%) at 9,946.12. The broad-based S&P 500 ended the week with a gain of +56.43 points (+1.86%) at 3,097.74. The Dow Industrial Average closed the week with a gain of +265 points (+1.04%) at 25,876. For the NASDAQ Composite Index Friday’s closing price was a new all-time weekly-close price high.
Price momentum data from the NYSE and the many ratios and moving averages of that data constructed and tracked by this newsletter produced mostly bullish weekly movements. However, among the new high/new low data- based moving averages the moving averages of NYSE weekly new 52-week highs continued to show that the inability of the NYSE to rapidly expand the weekly “New High” continues to be the Achilles heel of the recovery rally in place since March 23. Of the five 5-week through 40-week moving averages of NYSE weekly new 52-week highs only the short-term 5-week and short intermediate-term 10-week moving averages rose. The 5-week moving average finally crossed above the 100 new highs mark to 105 new highs. It has consumed 10 weeks struggling to rise to this level. The next-longer 10-week moving average still has not surpassed the 100 new highs mark, rising to 80.9 new highs after five consecutive weekly advances. All three 20-week through 40-week moving averages continued to decline.
Moving averages of NYSE weekly new 52-week lows continued falling across the board from 5-week through 40-week moving average time periods. It remains the acute absence of selling pressure which is allowing the upward price trends of the four major stock indices to continue unmolested. The shortest-term 5-week moving average fell to just 20 new lows this past week. While this is a depth to which it has only rarely sunk in the past, it can and has gone lower, having reach an all-time low of just 4 weekly new 52-week lows in September 2009.
With moving averages of NYSE weekly new lows sinking toward historically extremely low levels the moving averages of NYSE weekly new high/new low ratios rose at all 5-week through 30-week moving average time periods and was effectively unchanged at the 40-week time period. The shortest-term 5-week moving average rose to 83.6% and is now fast approaching its high inflection point from January 17 of this year at 93.0%. We should note that this high water mark was posted approximately one month in advance of the S&P 500, Dow Industrial Average and NASDAQ Composite Index posting their all-time daily-close price highs in mid-February.
Moving averages of NYSE weekly “percent of stocks rising” ratios rose at the 5-week, 20-week and 30-week time periods, but fell at both the 10-week and 40-week time periods. The decline of the 10-week moving average was expected because its calculation was “replacing” a monster ratios of 95.4% from the week of April 6-10. All five-week through 40-week moving averages remained comfortably above the critical 50.0% line.
Yield spread data from the U.S. bond market was bullish for the major stock indices. The “Merrill Lynch Confidence Index” rose to 38.98 from 37.48 on June 12, putting that date and level on the board as at least a short-term low inflection point. The “junk” “BB”-rated Bond Index yield fell to 4.72% from 5.07% on June 12. The Corporate Bond/Treasury Bond Yield Spread fell, dropping by -2 basis points to +117 basis points from +119 basis points on June 12.
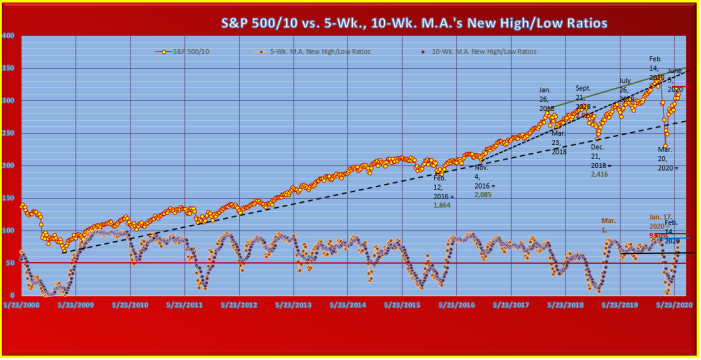
Our long-term chart of the S&P 500 Index that uses only its weekly-close prices also compares that index with both the short-term 5-week and short intermediate-term 10-week moving averages of NYSE weekly new high/new low ratios. We have divided the S&P 500 price lone on the chart by a factor of 10 for scaling purposes. Price levels for specific dates noted are actual, unscaled price levels.
The S&P 500 portion of the chart shows that the weekly-close price high to date for the recovery rally since March 23 was posted on Friday, June 5 at 3,193. At its close this past Friday at 3,097 the S&P was below this recovery rally high by -3.0%. We have placed a horizontal technical resistance line at the June 5 weekly-close high to designate it as a potential future technical resistance to further price rise. This resistance line is likely to be tested between today and mid-July.
On the 5-week and 10-week moving averages of NYSE weekly new high/new low ratios portion of the chart we first wish to call attention to the short-term 5-week moving average which moved up this week to end at 83.6%. As the chart shows, it is now drawing ever-closer to its January 17 peak high inflection point at 93.0%. Please note that this was an intermediate-term rather than a short-term high inflection point. It was posted approximately one month in advance of the associated S&P 500 all-time weekly-close price high made on February 14, 2020 at 3,380. When we look at the upcoming weekly ratios due to drop and be “replaced” in the 5-week moving average calculation we should conclude that there is considerable doubt that the 5-week moving average will rise to match its January 17, 2020 peak high.
Upcoming ratios due to drop and be “replaced” in the 5-week moving average calculation will average 83.6%/week for the next five weeks through Friday, July 24. In the three weeks starting with the week of July 6-10 they will average 87.0%/week. This past week’s ratio was 83.0%. There is therefore a very nearly certain probability that the 5-week moving average will produce a peak high inflection point and turn downward by no later than Friday, July 24. Using the one-month time lag between its peak high on January 17, 2020 and the S&P 500 peak high weekly-close price on February 14, 2020 as a guide we can estimate that the S&P 500 recovery rally will end no later than on Friday, August 21 and could end well before that date if the 5-week moving average peak high is posted before July 24.
Turning our attention to the next-longer 10-week moving average of NYSE weekly new high/new low ratios we see that as of this week it has risen to 66.8%. This puts it right at the technical resistance line we have placed across its June 28, 2019 and August 30, 2019 “twin lows” at 67.6% and 68.0% respectively. We should have no doubts that by next Friday the 10-week moving average will have no problem pushing up through and above this resistance line because for the next two weeks the weekly ratios due to drop and be “replaced” in its calculation will be very low figures of 45.0% and 38.0%. In fact, for the upcoming five weeks through July 24 weekly “replacement” ratios will average just 49.9%/week. After July 24 that weekly “replacement” ratio average will rise to 83.6%/week through Friday, August 28. We can be reasonably confident that the 10-week moving average will continue rising through at least Friday, July 24. But, for it to rise to equal its February14 peak high from earlier this year by July 24 will require that the NYSE produce weekly new high/new low ratios that will average 90.0%/week for the next five weeks. The NYSE is very unlikely to do such a thing. We can therefore also be reasonably confident that the horizontal technical resistance line we have placed at the 10-week moving average peak high from February 14, 2020 will hold and not be penetrated to the upside.
Earlier this year the S&P 500 all-time weekly-close price high was made exactly simultaneously with the 10-week moving average intermediate-term peak high inflection point on February 14, 2020. Since we can fairly accurately forecast that the 10-week moving average will post its recovery rally peak high inflection point for Friday, July 24 we may also fairly accurately forecast that the S&P 500 recovery rally peak high weekly-close price high will be made no later than on that date.
Click on link to see entire document, view in web-layout mode;
