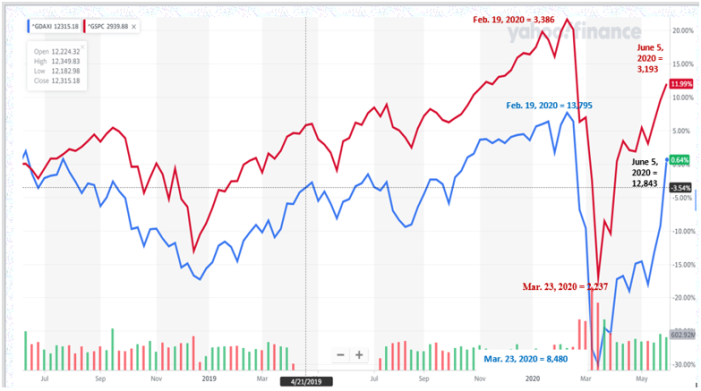
The chart below compares the benchmark U.S. index, the S&P 500 with the benchmark European stock index, the German $DAX Index for the past two years. It is essential for U.S. investors to believe that strongly bullish price movements made by their U.S. indices are being matched by equally strong bullish price movements by global stock indices, particularly European indices. The comparison chart below shows that the strongly bullish moves by the S&P 500 are indeed being matched by equally strong bullish moves by the $DAX.
Since its March 23 “Coronavirus Crash daily-close price low at 2,237 was posted the S&P 500 has gained +42.7%. Over the same time period the German $DAX has gained +51.5%. The chart below shows that both indices are fast approaching their respective all-time daily-close price highs from February 19 of this year. For both indices these price levels will be natural technical resistance obstacles to continued upward movement. When the time comes, it will be interesting to see of both indices can succeed on “breaking out” to the upside through and above these natural technical resistances. An upside “breakout” by one that is not confirmed by the other would be a negative divergence that would likely warn that the rapid upside price trends for both since March 23 were nearing their ends. But, an upside “breakout” by one index that is quickly confirmed by the other would be a bullish signal that both indices would likely continue rising price trends for several weeks or months into the future.