NASDAQ Composite Set New All-time Weekly-Close Price High
All four major stock indices closely tracked by the Stonehenge Analytics newsletter produced huge weekly price gains this past week, capped off by monster daily gains on Friday in response to a surprisingly strong monthly employment report from the Bureau of Labor Statistics. The BLS reported that non-farm payrolls actually expanded by +2.5 million jobs in May, as the lifting of state “lockdown” orders had been followed by recalls of furloughed workers much more quickly than had been anticipated by virtually all economic forecasters. This unexpected addition to U.S. payrolls lowered the nation’s unemployment rate to 13.3% from 14.7% in April. Friday’s stock market reaction was a massive, broad-based rally that added to the already impressive weekly price gains registered from Monday through Thursday. Both the Dow Transportation Average and Dow Industrial Average rose by more than +3.0% on Thursday alone.
The top performing index for the week on a percentage basis was the Dow Transportation Stocks Average that gained +903 points (+10.07%) to close at 9,872. The next best performer on a percentage basis was its companion Dow Industrial Average that gained +1,727 points (+6.81%) to close at 27,110. The broad-based S&P 500 Index rose by +149.62 points (+4.91%) to close at 3,193.93. For these three indices their Friday closing prices were their highest daily and weekly-close prices for their recovery rallies in place since March 23. But, none reached the promised land of setting new 52-week or all-time price highs. The technology stock-heavy NASDAQ Composite Index that rose by +324.21 points for the week (+3.42%) to close at 9,814.08 did reach that promised land by setting a new all-time weekly-close price high, topping its previous all-time weekly-close high from February 14 of this year at 9,731.18. The NASDAQ barely missed setting a new all-time daily-close high, falling short of topping its February 19 daily-close high at 9,817.18.
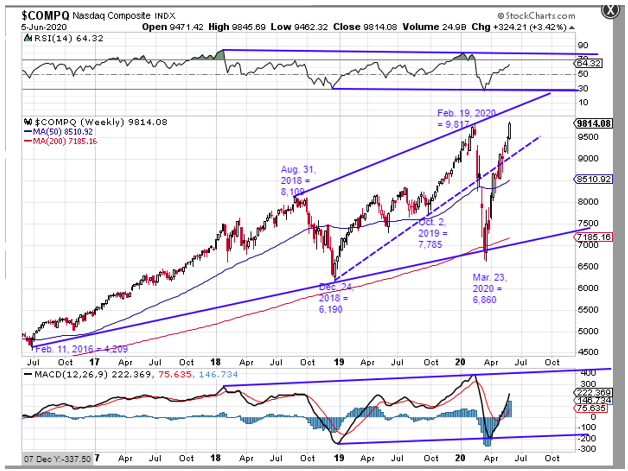
The chart below of the NASDAQ Composite Index ($COMP) begins on January 2, 2016.It shows that the $COMP Index never broke its long-term up-trend line of rising February 11, 2016 and December 24, 2018 lows to the downside at its March 23 “Coronavirus Crash” low. For the $COMP Index there has been no “bear market”, regardless of what talking heads on financial news media outlets might have said to the contrary. The $COMP Index has completely regained the dashed, broken intermediate-term up-trend line of rising lows made after December 24, 2018 which sustained its upward run to a new all-time daily-close price high it posted on February 19 of this year just +3 points above its Friday closing price. We should not be surprised that it is the first of the major U.S. stock indices to find its way back onto the “New High” list.
Technical indicators above and below the price chart display bullish trend channels since January 2018 which confirm the conclusion that there has been no “bear market” by the $COMP Index. We will point out that both indicators still have plenty of upside room to run before reaching the top channel lines of their respective trend channels. The Stonehenge Analytics expectation is that the $COMP Index will continue trending upward in price at least until it reaches the line of rising August 31, 2018 and February 19, 2019 highs we have drawn on its chart. This line is currently at approximately 10,200 and is rising with time. By August 1 it will be at approximately 10,350. This upside target price is above the Friday closing price of 9,814 by +5.5%. From a technical chart perspective there is little standing in the way of the $COMP Index attaining that target price, or even higher, over the summer months.