This Week’s Market
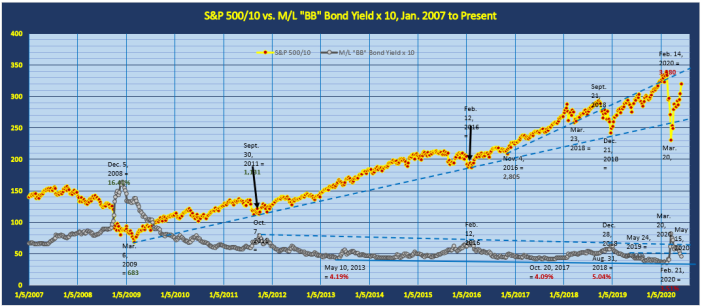
The long-term chart below is from the Weekly Update in-house chart library. It compares the S&P 500 Index with the Merrill Lynch “BB”-rated Bond Index yield. On the chart below we have divided the S&P 500 price line by a factor of 10 and multiplied the “BB”-rated Bond Index yield by a factor of 10 for scaling purposes. Levels shown for specific dates on both data series are actual, unscaled levels.
The S&P 500 portion of the chart shows that there are few remaining technical obstacles to the S&P continuing to rise until it at least matches its February 14 all-time weekly-close price high at 3,380. The old, broken “Trump Rally” up-trend line of rising November 4, 2016 and March 23, 2018 weekly-close lows still remains as a potential technical restraint, but it is currently at approximately 3,325 and by mid-July will have risen above the February 14 all-time high.
The “BB”-rated Bond Index yield portion of the chart shows that as of this past week it has fallen down through and below a potential technical support at its May 24, 2019 “lower high” yield of 4.84%. There are few if any technical obstacles between its current level of 4.63% and its February 21 all-time yield low at 3.51%.
The entire chart history demonstrates how closely correlated are “BB”-rated Bond Index yield intermediate to long-term yield highs with S&P 500 intermediate to long-term weekly-close price lows and vice-versa. What this long history tells us is that a continuing downward trend by the “BB”-rated Bond Index yield will result in a continuing upward trend in the S&P 500 price. For the present, the key technical level for the “BB”-rated Bond Index yield is that May 24, 2019 “lower high” yield at 4.84%. As long as the yield remains below this level we must presume that it will continue trending downward.
Our in-house daily data moving averages of NYSE advance/decline ratios and new high/new low ratios will once again favor upward weekly price movement by the S&P 500.We would not be terribly surprised if the S&P were to rise as highs as the 3,300 to 3,350 price range by the end of the week. To the downside we do not see much chance that the S&P might fall below the 3,100 price level.
