Our in-house daily data-based indicators favor this expected August price decline beginning during the upcoming week. We would be quite surprised if the S&P 500 were to rise again to match its daily-close high from last week made on Wednesday, July 25 at 2,846. To the downside, our initial downside target is at the S&P 500 intraday price low from July 11 at 2,770. However, we are reasonably confident that the ultimate downside destination for the S&P will be to at least re-test its daily-close low from June 27 at 2,718. And, depending on evets, the S&P could seek a much lower price destination in the second half of August.
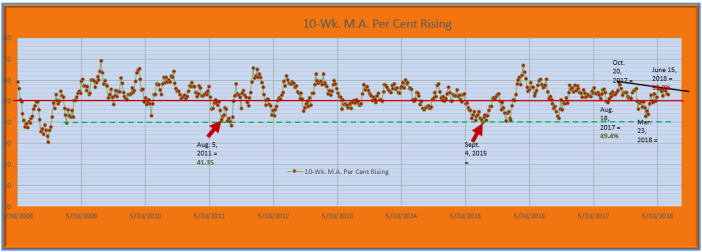
The chart above is from out in-house library. It depicts a short intermediate-term 10-week moving average of what we call weekly “percent of stocks rising” ratios on the NYSE. Thee weekly ratios are calculated by taking the number of weekly advancing issues on the NYSE and dividing that figure by that week’s total of both weekly advancing and declining issues. Issues that were unchanged for the week are excluded from the calculation. A weekly ratio of 50.0% is produced when the number of weekly advancers is equal to the number of weekly decliners. A weekly advance/decline ratio of 2-to-1 in favor of advancing issues produces a weekly “percent of stocks rising” ratio of 66.6%. A 2-to-1 ratio in favor of declining issues produces a weekly “percent of stocks rising” ratio of 33.3%. The key level is thus always at the horizontal line set at the 50.0% mark.
Every movement by the 10-week moving average of weekly “percent of stocks rising” ratios below the 50.0% mark over the chart history which starts in May 2008 has been accompanied by an S&P 500 price decline of at least short-term “pullback” dimension. Movements by the 10-week moving average below 45.0% have generally been accompanied by S&P price declines that lasted for multiples of weeks and lowered that index by more than -5.0%. This year’s downward move by the 10-week moving average to its March 23 low at 42.82% was accompanied by an S&P 500 price decline of -10.1% measured from the S&P daily-close price high of January 26 at 2,872 to its daily-close price low of 2,581 on April 2. As the chart shows, the 10-week moving average has established a 9-month down-trend line of successively falling highs made on October 20, 2017 and June 15, 2018 that it has unsuccessfully attempted to breach to the upside in July. This should be a very large clue to us that its next move of significance will likely be in the downward direction.
We know for certain the weekly ratios due to drop and be “replaced” in the 10-week moving average calculation each week. For the next three weeks through Friday, August 17 these weekly “replacement” ratios will average a historically very high 60.5%/week. The 10-week moving average, currently at 53.17%, down from 53.47% on July 20, will fall below the 50.0% mark if the NYSE produces weekly “percent of stocks rising” ratios that average less than 49.6%/week for the next three weeks. There is a very high risk that the NYSE will do exactly that, especially now that “earnings season” is winding down and there is less and less good earnings news to be anticipated. In the week of August 13-17 the weekly ratio due to be “replaced” in the 10-week moving average calculation will be an exceptionally high figure of 67.6%. This means that there will be an exceptionally high risk that the 10-week moving average will take a very steep drop that week similar to steep drops it took in August 2011 and August 2015 that are highlighted with red arrows on the chart below. As the chart shows, these steep August drops by the 10-week moving average in August 2011 and August 2015 took the 10-week moving average well below the 50.0% mark and even down below 45.0%. Needless to say, very steep and sharp S&P price declines accompanied these steep drops by the 10-week moving average. The opportunity for these steep August sell-offs to happen again this coming August will be present. The chart below cannot tell us if the S&P 500 and other stock indices will seize this opportunity to suddenly collapse, but there is certainly historical precedent for them to do so and the chance to do it will be available.
Based upon the chart history below and the forward “replacement” analysis for the 10-week moving average of weekly “percent of stocks rising” ratios it is Stonehenge Analytics conclusion that a downward price movement of at least short-term “pullback” dimensions is simply unavoidable in August. Once begun, this “pullback” will have technical conditions present which will allow it to morph into a full-scale panic attack sell-off that lowers the S&P 500 by more than -10.0% as happened in August 2011 and August 2015. Whether or not a full-scale panic attack takes place will likely be dependent upon upcoming news events. First on that list will be the quarterly earnings report for another NASDAQ-listed high-flier, Apple Computer (AAPL), which will report this week. Unlike Facebook, Apple is a component of the Dow Industrial Average.
