Week Ending July 27, 2018
This week’s chart package presents evidence from multiple sources that strongly favor that the S&P 500 and Dow Industrial Average will suffer downward price movements of at least short-term “pullback” dimensions between today and Friday, August 31. While this evidence does not support a case for expecting a deeply damaging price decline we do present evidence form the 10-week moving average of weekly “percent of stocks rising” ratios that the opportunity will be present, particularly in the week of August 13-17 for a very rapid and steep price decline similar to those experienced by the major stock indices in August 2011 and in August 2015. What we cannot determine beforehand is whether or not that opportunity will be seized by the major stock indices. We can only warn that the potential for a repeat of August 2011 and August 2015 will be present in August 2018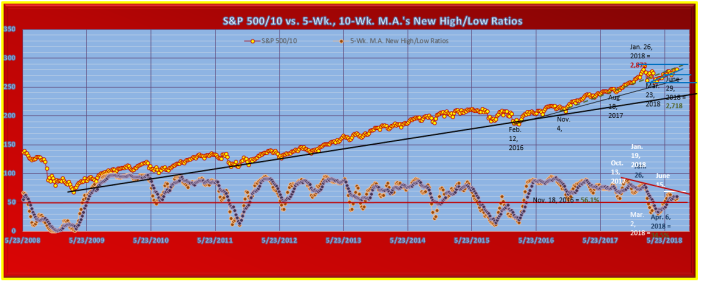
Despite a weekly price decline by the NASDAQ Composite Index of -82.78 points and -1.06% to close at 7,737.42 that was caused by the -19.0% implosion of Facebook (FB) on Thursday in response to quarterly results that were below expectations and a downbeat forecast of future results stemming from its frantic efforts to clean up its heretofore lackadaisical attitude toward protecting its users’ private data, the two Dow indices enjoyed a week of solid price gains. The Dow Industrial Average rose by +392 points and +1.56% for the week to close at 25,451. This was its highest weekly-close price since the week that ended on June 8. The Dow Transportation Stocks Average posted a weekly price gain of +216 points and +2.01% to close at 10,957. This was its highest weekly-close price since the week that ended on June 15 when it ended the week at 11,073. The S&P 500 posted a weekly price gain despite the Facebook collapse, rising by +16.99 points and +0.61% to close at 2,818.82. For the S&P 500 Friday’s closing price was its highest weekly-close price since it January 26 all-time weekly-close and daily-close price high at 2,872.
The price momentum data from the NYSE and many ratios and moving averages of that data constructed and tracked by the Druitt’s Weekly Data Charts newsletter each week once again produced inconsistent and mixed results. The short-term 5-week moving averages of weekly new high/new low-based data series produce consistently bullish weekly movements with weekly new highs turning to rising from falling, weekly new lows continuing to decline, and the 5-week moving average of weekly new high/new low ratios turning upward to end a 5-week decline since the week that ended on June 15. Only the 5-week moving average of weekly “percent of stocks rising” ratios derived from NYSE weekly advance/decline statistics behaved bearishly by falling. But, at the next-longer 10-week moving average time period it was a very different story. The 10-week moving average of weekly new 52-week highs fell for a second consecutive week, but was contradicted by the 10-week moving average of weekly new lows that rose for a fourth consecutive week. The moving average of weekly new high/new low ratios rose, but just barely, while the 10-week moving average of weekly “percent of stocks rising” ratios fell, reversing a brief two-week rise. Even the intermediate-term 20-week moving average could not produce consistently bullish or bearish weekly movements. Though all of the new high/new low based data series behaved bullishly the 20-week moving average of weekly “percent of stocks rising ratios did not. It suffered a large weekly decline to 51.71% from 53.46% on July 20, ending a seven-week rising trend since posting a low at 49.49% in the week that ended on June 1 and also establishing its July 20 level of 53.46% as a high inflection point of at least short-term significance.
At the longer intermediate-term 30-week and 40-week moving average time periods there was some consistency and that consistency continued to be in the bearish price direction for the major stock indices. All new high/new low-based data series behaved bearishly as, did the “percent of stocks rising” ratios. The big risk here is that with these longer-term moving average time periods continuing to produce consistently bearish movements week after week any turn by the short to intermediate-term moving average data series to a consistently bearish direction will put all moving averages from the short-term 5-week to the long intermediate 40-week simultaneously moving in bearish directions. Under that technical condition it would be possible and even likely that the major stock indices would produce very damaging and simultaneous multi-week or even multi-month price collapses.
Weighing in against any such highly damaging price collapse taking place in the near-term future were the Yield Spread data series from the U.S. bond market. For and third consecutive week the Merrill Lynch Confidence Index rose, moving up this past week to 73.27 from 71.29 on July 20. The Corporate Bond/Treasury Bond Yield Spread between the Dow-Jones U.S. Investment Grade Bond Index Yield and the 10-year U.S. Treasury Note Yield fell for a third consecutive week, dropping to +95.5 basis points from +98 basis points on July 20. As long as these two bond market Yield Spread indicators continue to move in directions that are bullish for the major stock indices the long correlative history between these two Yield Spread indicators and he direction of price movement of the S&P 500 Index and Dow Industrial Average tells us that there will be zero chance of a highly damaging downward price movement by those two major stock indices.
Our long-term chart of the S&P 500 Index that uses only its weekly-close prices is also a comparison of that index with both the short-term 5-wweek and short intermediate-term 10-week moving averages of the ratio of weekly new 52-week highs on the NYSE divided by that week’s total of both new highs and new lows. The S&P 500 has been divided by a factor of 10 on the chart for scaling purposes
We have chosen to display this chart because over the upcoming five-week time period through Friday, August 31 the two moving averages of weekly new high/new low ratios will likely move in opposite and conflicting directions for the first two weeks before moving simultaneously in the same direction from Monday, August 13 through Friday, August 31. The simultaneous direction to be taken for those three weeks will more likely be downward than upward. This means that the short-term 5-week moving average of weekly new high/new low ratios that changed its direction to rising from falling this past week, moving up to 58.1% from 56.2% on July 20, will have an opportunity to re-test its recently-made short-term high at 65.2% from the week that ended on June 15 from which we have drawn a white horizontal technical resistance line on its chart. A failure by the 5-week moving average to “break out” to the upside through and above its June 15 high will perpetuate its currently-operative down-trend line of successively falling short-term highs made on October 13, 2017 and January 19, 2018 shown on the chart as the red down-trend line. A perpetuation of the down-trend line would be an intermediate to long-term bearish signal for the S&P 500 Index.
Upcoming weekly ratios due to drop and be “replaced” in the 5-week moving average calculation will be just 36.5% in the upcoming week of July 30-August 3 and 54.0% in the week of August 6-10. For the 5-week moving average to reach the technical resistance line at 65.2% by August 10 the NYSE must produce weekly new high/new low ratios that will average at least 63.0%/week for the next two weeks. This is a forward “hurdle rate” that is well within the realm of possibility. However, to keep the 5-week moving average at or above the level it reaches on August 10 the NYSE must produce weekly new high/new low ratios that will average at least 66.7%/week for the following three weeks of August 13-31. This will be much more difficult for the NYSE to accomplish. Since the week that ended on January 26 of this year the NYSE has produced a three-week average of 66.7%/week only in the three weeks leading up to the S&P 500 weekly-close price high made on June 15 at 2,779 from which the S&P conducted a short-term “pullback” that lowered it by – 3.12% from a daily-close high price of 2,786 that it posted on June 12 to a daily-close low price of 2,699 that it posted on June 27. This forward “replacement” ratio analysis for the 5-week moving average strongly indicates that even if the S&P manages to continue to trend upward in price through August 10 it will likely give back any price gains made in the following three weeks from August 13 through August 31. The S&P 500 price level on August 31 is likely to be no higher than it is today and could be significantly lower. The Druitt’s Weekly Data Charts opinion is that longer-term investment-oriented accounts have no reason to be in a hurry to purchase U.S. stocks at the current time.
The short intermediate-term 10-week moving average of weekly new high/new low ratios has been trending upward since making a very significant low at 34.5% in the week that ended on April 6 and continued rising this past week by inching up to 61.5% from 61.0% on July 20. It has a much more challenging task ahead of it for the next two weeks than does the short-term 5-week moving average. In the upcoming two weeks through August 10 the 10-week moving average calculation must “replace” weekly ratios of 66.0% and 60.0%. It will thus be very possible for the short-term 5-week moving average to continue rising through August 10 while the longer-term 10-week moving average remains unchanged or even declines slightly. Short-term oriented and more speculative stock market players will have to make a choice as to which new high/new low ratio moving average is most likely to provide the more dominant influence on S&P 500 price direction for the next two weeks. For the three-week tine period that will begin on Monday, August 13 the 10-wek moving average calculation must “replace” weekly ratios that will average 65.5%/week through August 31. This is almost the identical three-week “replacement” average for this same time period as is that for the short-term 5-week moving average. It is therefore very nearly a 100% mathematical certainty that the two new high/new low ratio moving averages pictured on the chart will move simultaneously in the same direction from Monday, August 13 through Friday, August 31. If that simultaneous direction is downward, which recent history suggests it likely will be, then we can expect that the S&P 500 Index will conduct an associated three-week price decline that will produce a daily-close price low in the final week of August or during the following Labor Day Holiday week.
The S&P 500 portion of the chart now includes a short-term up-trend line of rising weekly-close price lows made on March 23 and June 29 of this year. Since the 5-week and 10-week moving averages of weekly new high/new low ratios are strongly indicating that a price decline of at least a three-week time duration is likely to take place during August this short-term up-trend line will come into play during that month, as will the horizontal technical support line drawn from the most recently-made June 29 weekly-close low at 2,718 along that up-trend line. Both the June 29 weekly-close low at 2,718 and June 27 daily-close low at 2,699 will stand a very good prospect of being re-tested in the second half of August. If the S&P 500 produces a decisive downside “breakout” through and below both price supports then a further decline by it to re-test the March 23 weekly-close price low at 2,588 will be possible. From the recently-made July 25 S&P daily-close price high at 2,846 to the June 27 daily-close price low at 2,699 would be a decline of -5.16%, a magnitude of price damage consistent with a healthy “pullback” within an ongoing intermediate-term rising price trend. In our view this makes the June 27 daily-close price low at 2,699 the most likely downside price target for the upcoming three-week price decline indicated by the 5-week and 10-week moving averages of weekly new high/new low ratios. We should add however that once a price decline has begun it can generate its own downward price momentum, an unpleasant fact of life proved once again by Facebook stock (FB) on Thursday of this past week. We therefore cannot rule out the possibility that the June 27 daily-close low price might not be held by the S&P 500 and a collapse down to a re-test of the March 23 weekly-close low at 2,588 could happen. A move down to this price level would lower the S&P 500 by -9.06% from its recently-made July 25 daily-close price high.
Click on link to see entire document, view in web-layout mode;
